

3.3k words, 13 min read

My son loves buildings now, and lately half the fun of a new Lego playset seems to be opening the box and looking at all the pieces. Police departments and fire stations are hot fodder for toddlers like him - maybe a form of civic indoctrination, getting kids familiar with the buildings that anchor their communities. But I had never noticed that there is no hospital set in his pile. We’re never really taught to appreciate a hospital, much less open one up and see what is inside.
Growing up, I never paid much attention to hospital buildings. Now that I’m a healthcare writer, I’ve become obsessed with them. The hospital is one of the biggest, richest, strangest institutions in any American city. It sits on enormous real estate (much of it tax-exempt). It employs a small city of people (even while it swears it can’t find enough nurses). And its investment portfolio may be big enough to make a banker salivate.
For a specific example, let’s pick Boston—arguably the top healthcare city in the country, if not the world—and its best hospital, Massachusetts General Hospital. I love the name “Mass General” for this essay because the place is truly massive, but the financial relationships inside it are surprisingly general. Let’s dig into the health system, Mass Gen Brigham, because MGB contains nearly every kind of way that hospital can make money.
I don’t think most Bostonians know how large that MGB is1. Mass General Hospital alone has 1,065 beds, while MGB operates 12 hospitals stretching from Boston out to Nantucket and up into New Hampshire. In 2025, MGB reported $22.8 billion in operating revenue, nearly five times the City of Boston’s entire $4.6 billion budget, for comparison. Those are different measures, but together they set the scale for what we’re talking about.
So how does a hospital make such a massive amount of money? An ordinary business sells a product, at a price, a bunch of times. But hospitals are different: MGB gets paid for treating patients, collects premiums for insuring them, performs research under grants and contracts, runs pharmacies, and earns returns on investments that sit outside the operation of its hospitals. All of that money belongs to one institution, but it arrives under different rules - and sometimes MGB does not get to name the price at all.
Amongst hospital playsets, MGB would be the deluxe version: hospital, insurer, research empire, pharmacy, and investment portfolio (and two-million-dollar drugs sold separately). The health system near you may be (slightly) smaller and may be missing half the pieces, but it still gets paid by governments, insurers, and patients, buys drugs and supplies, and pays the people who keep it open. Open this box and almost every kind of hospital relationship is inside, each one big enough to pick up and turn over in your hand.
Open the box
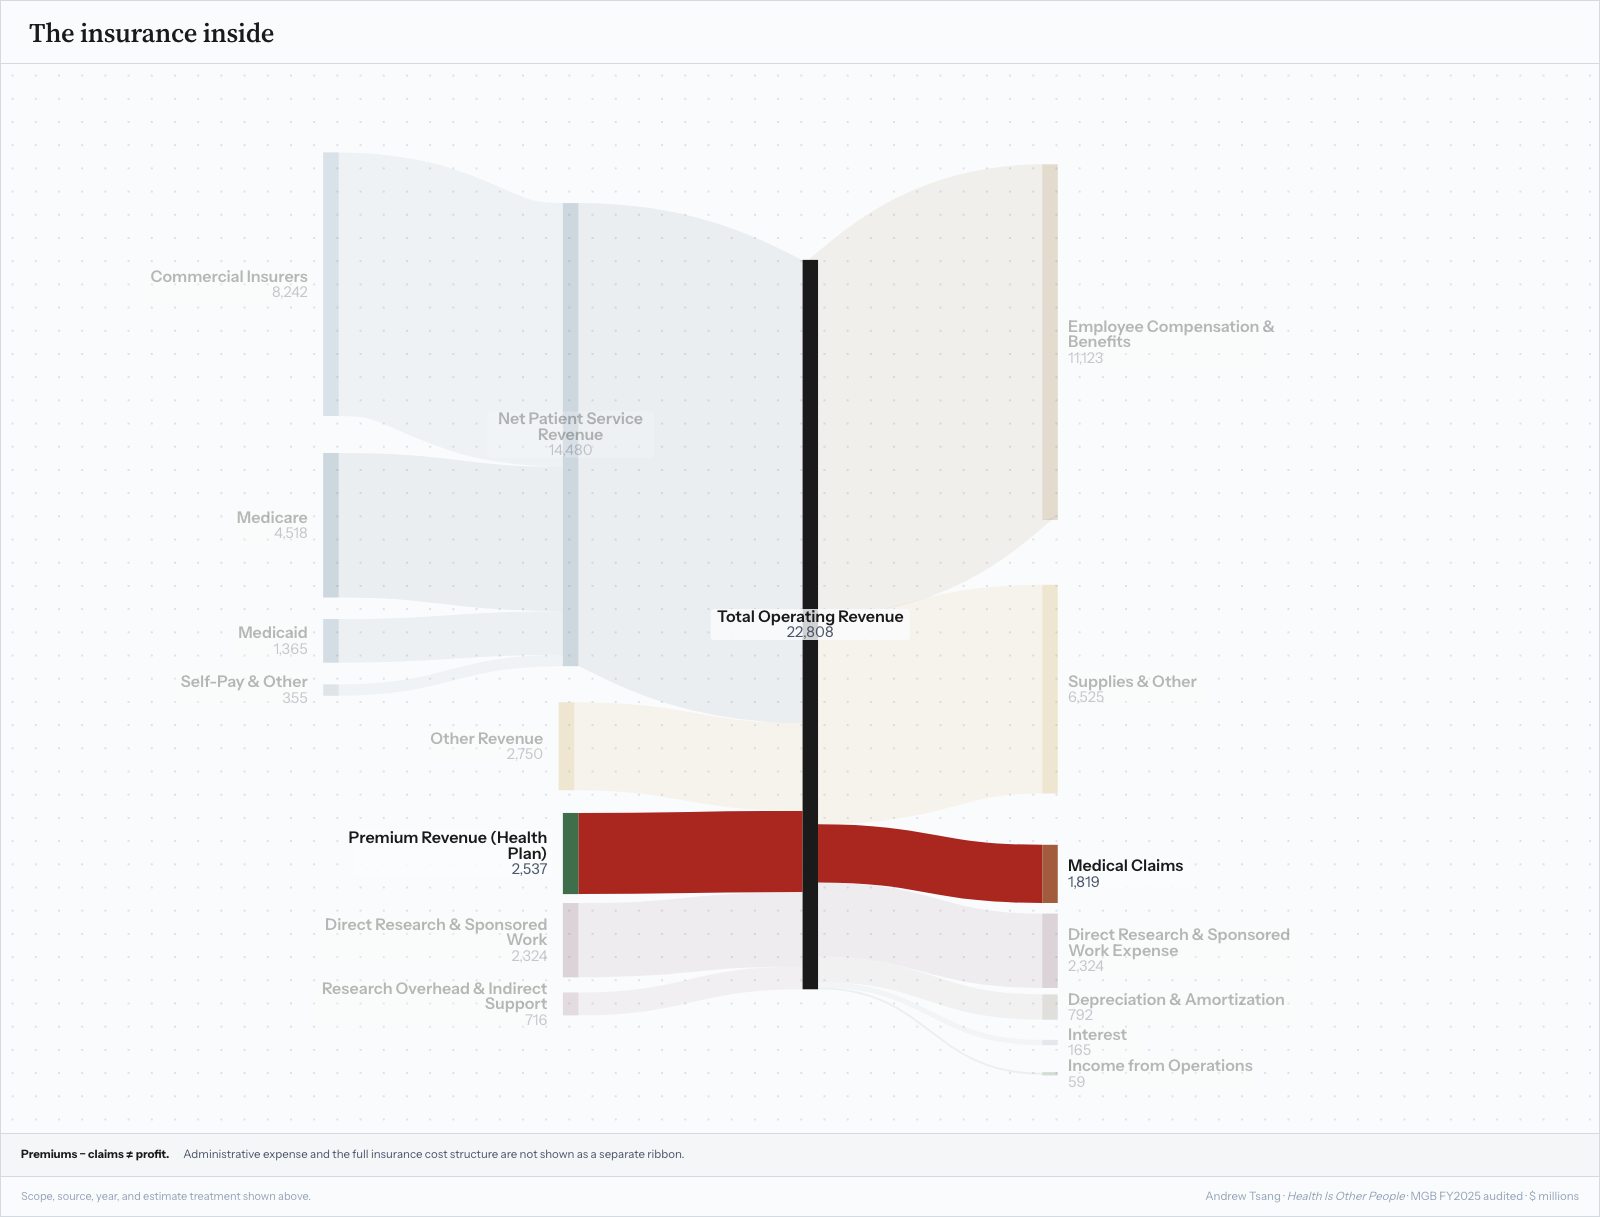
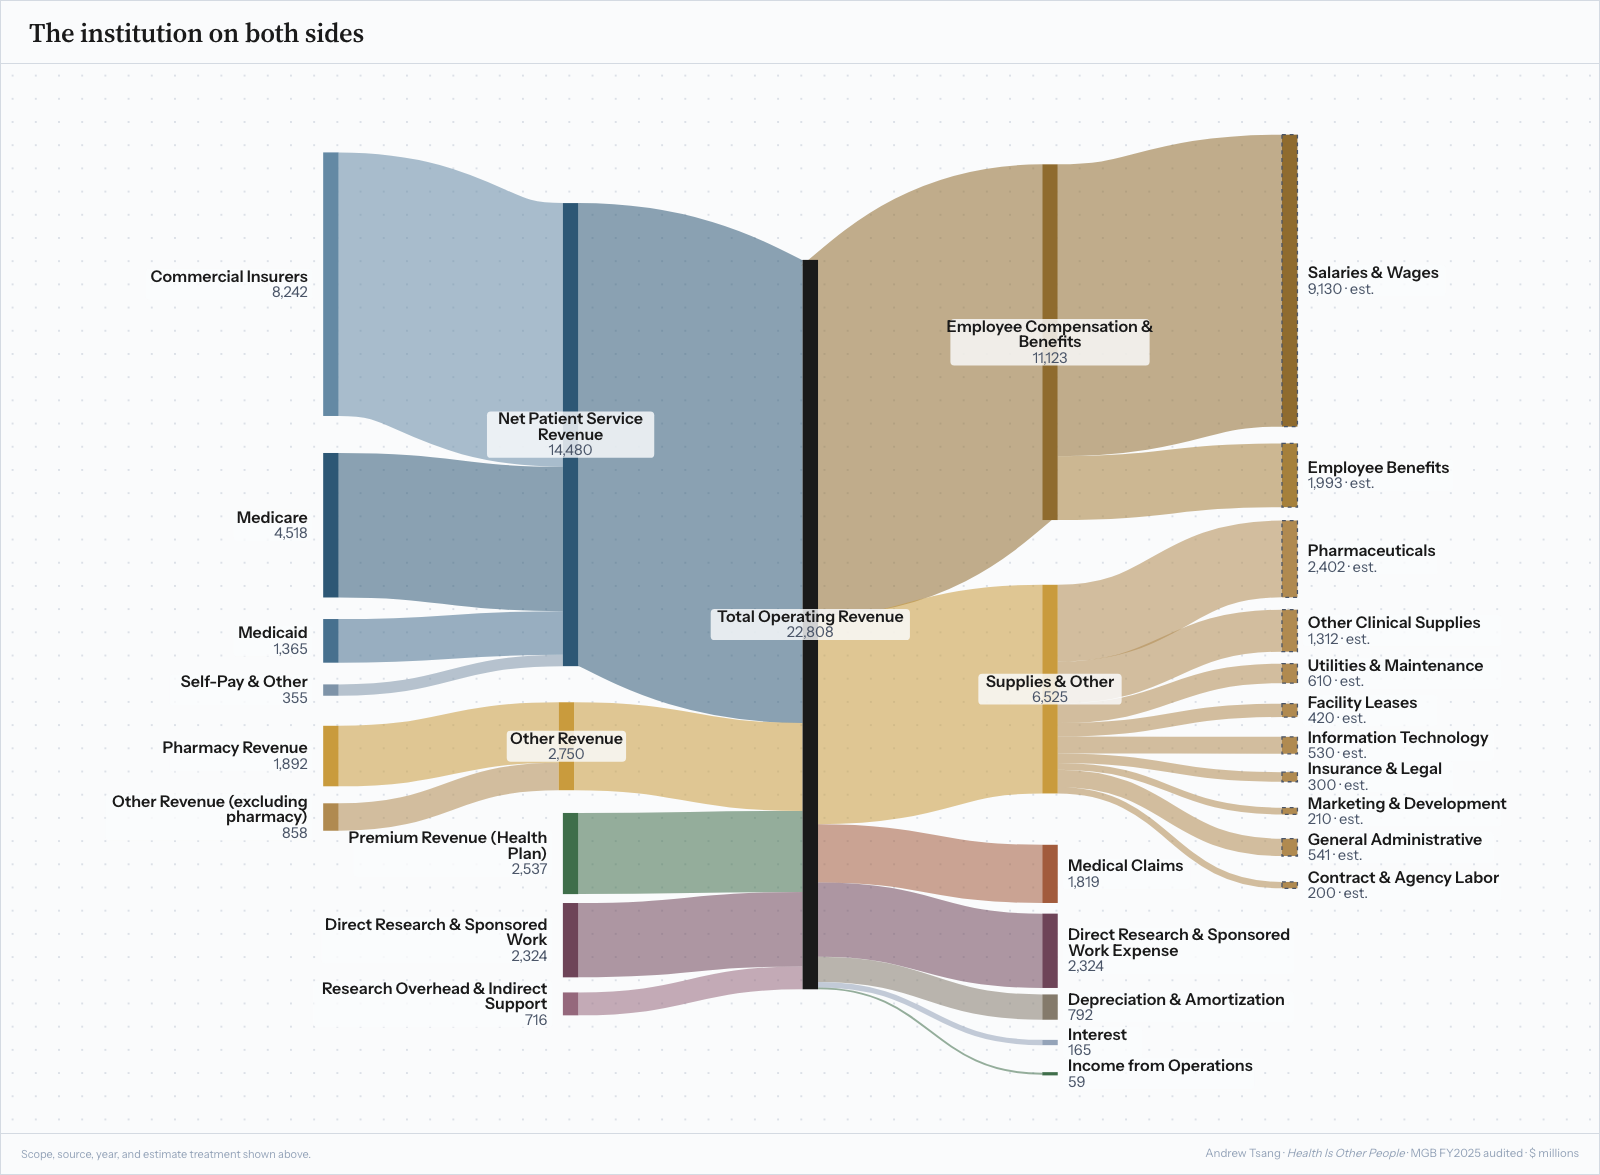
Here is Mass Gen Brigham’s FY2025 operating statement, opened up as one of my patented Tsang-key diagrams. Just under $23 billion enters from the left and exits through the right.
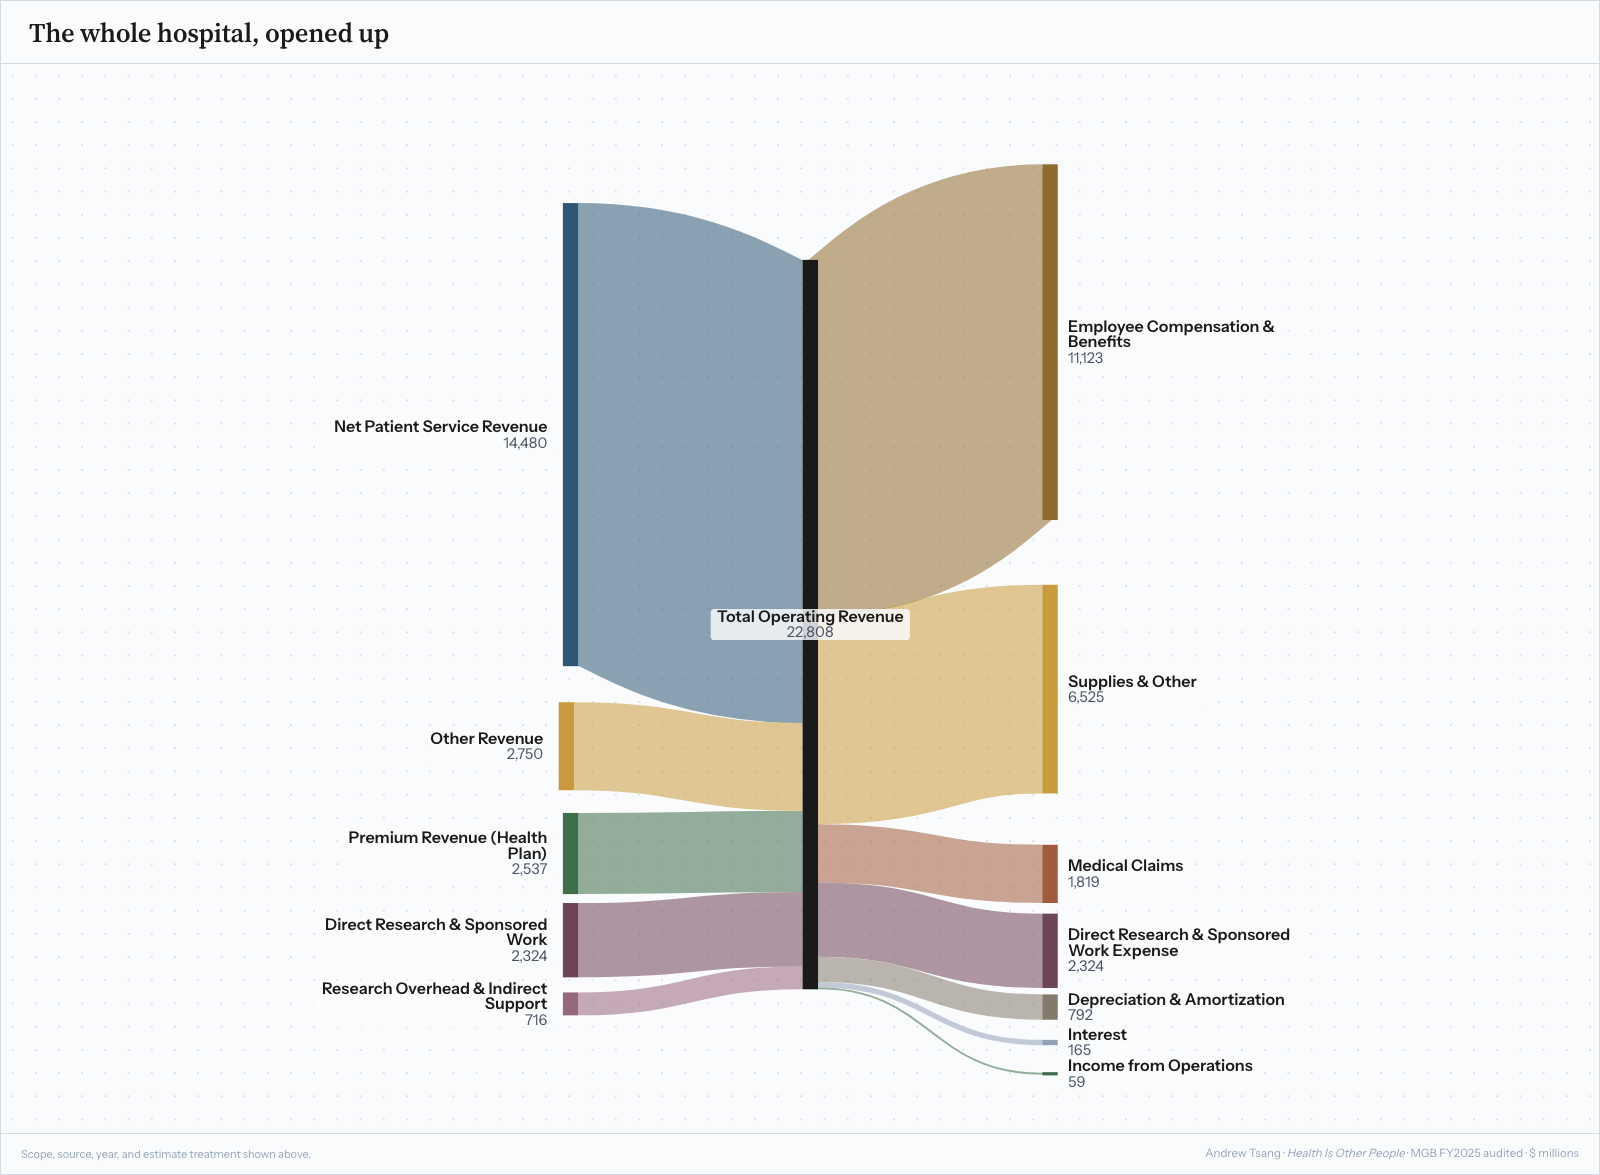
Like any Lego set, start by sorting the pieces. The width of each piece shows the dollars, but the kind of business changes as the money moves. Every time the counterparty changes, ask what else changed with it: who sets the price, who bears the risk, what work comes attached, and when the money becomes available or the bill comes due.
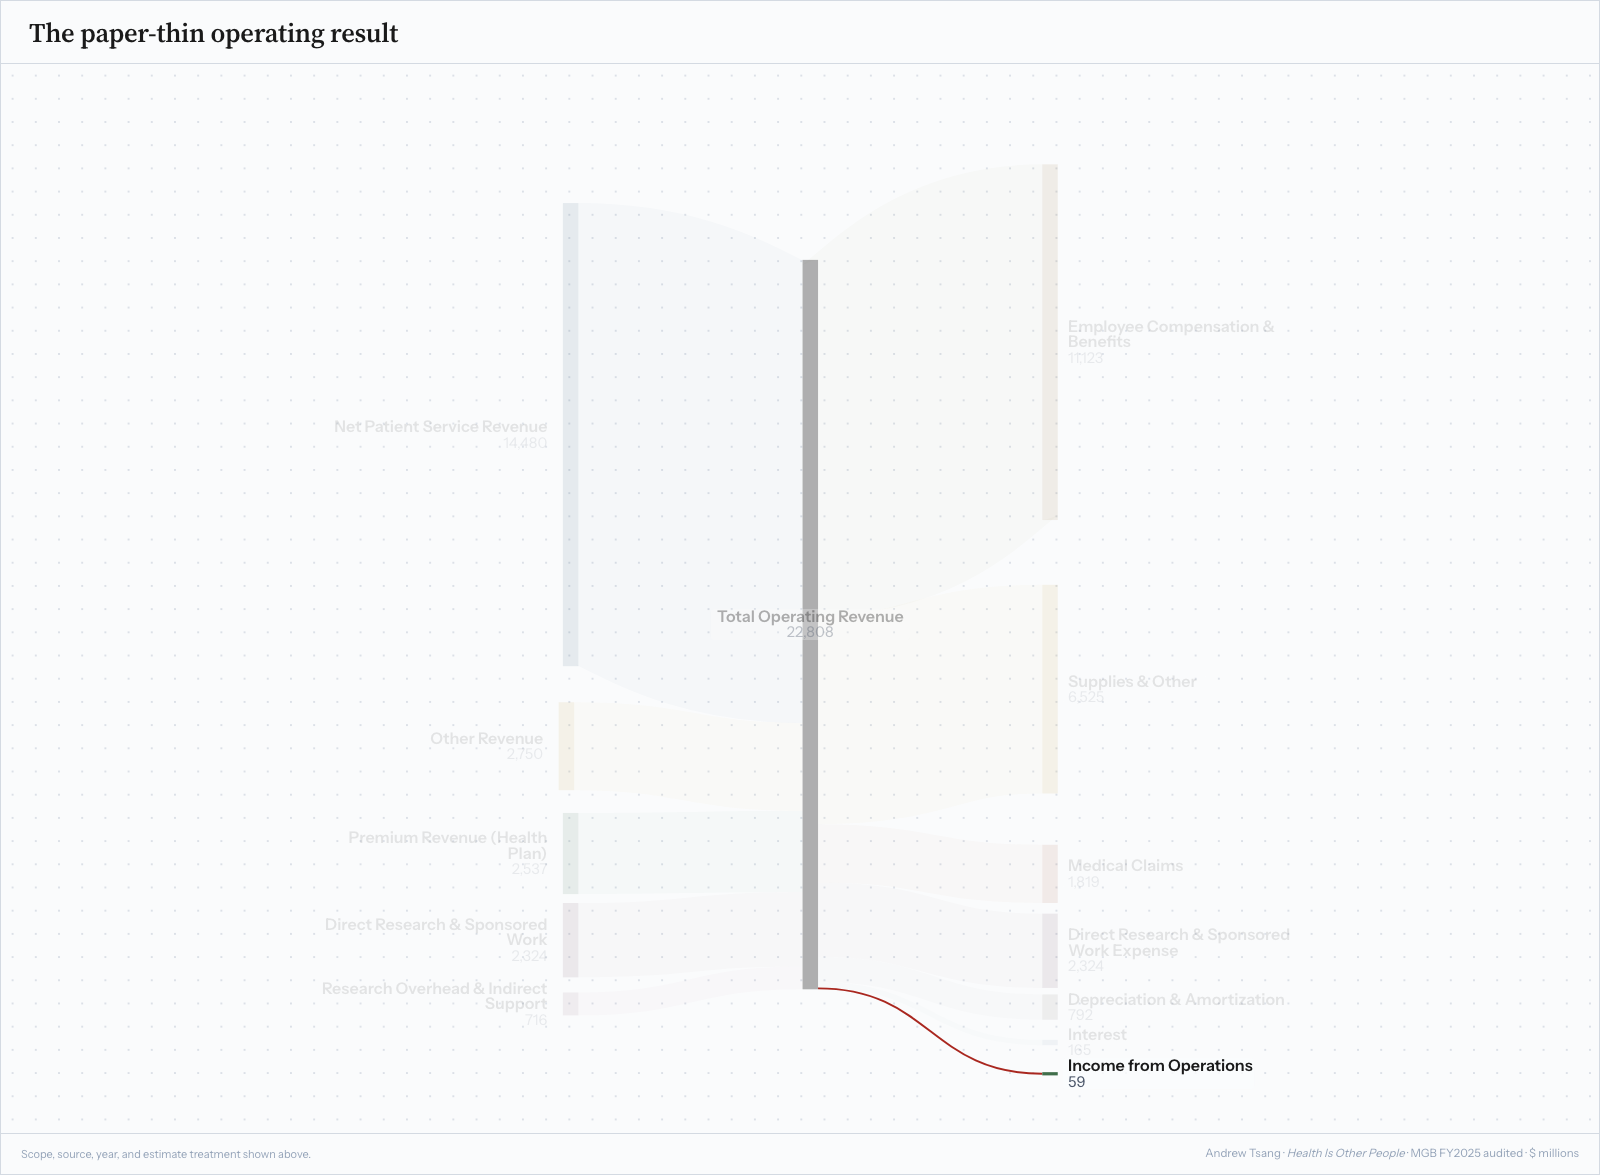
Follow the ribbons of the diagram to the bottom right and you hit a paper-thin one: income from operations, $59 million. To the average person, $59 million of profit seems high for a hospital system - until you remember that it is about 25¢ of profit on $100 of revenue.
Who put the price there?
If there is one thing people do know about hospitals, it is that they make money treating patients, so it comes as no surprise that the biggest revenue ribbon is $14.5 billion of patient care: treating people, coding claims, and billing insurers. Here the useful distinction is where a hospital is a price-taker and a price-maker.
The prices it takes
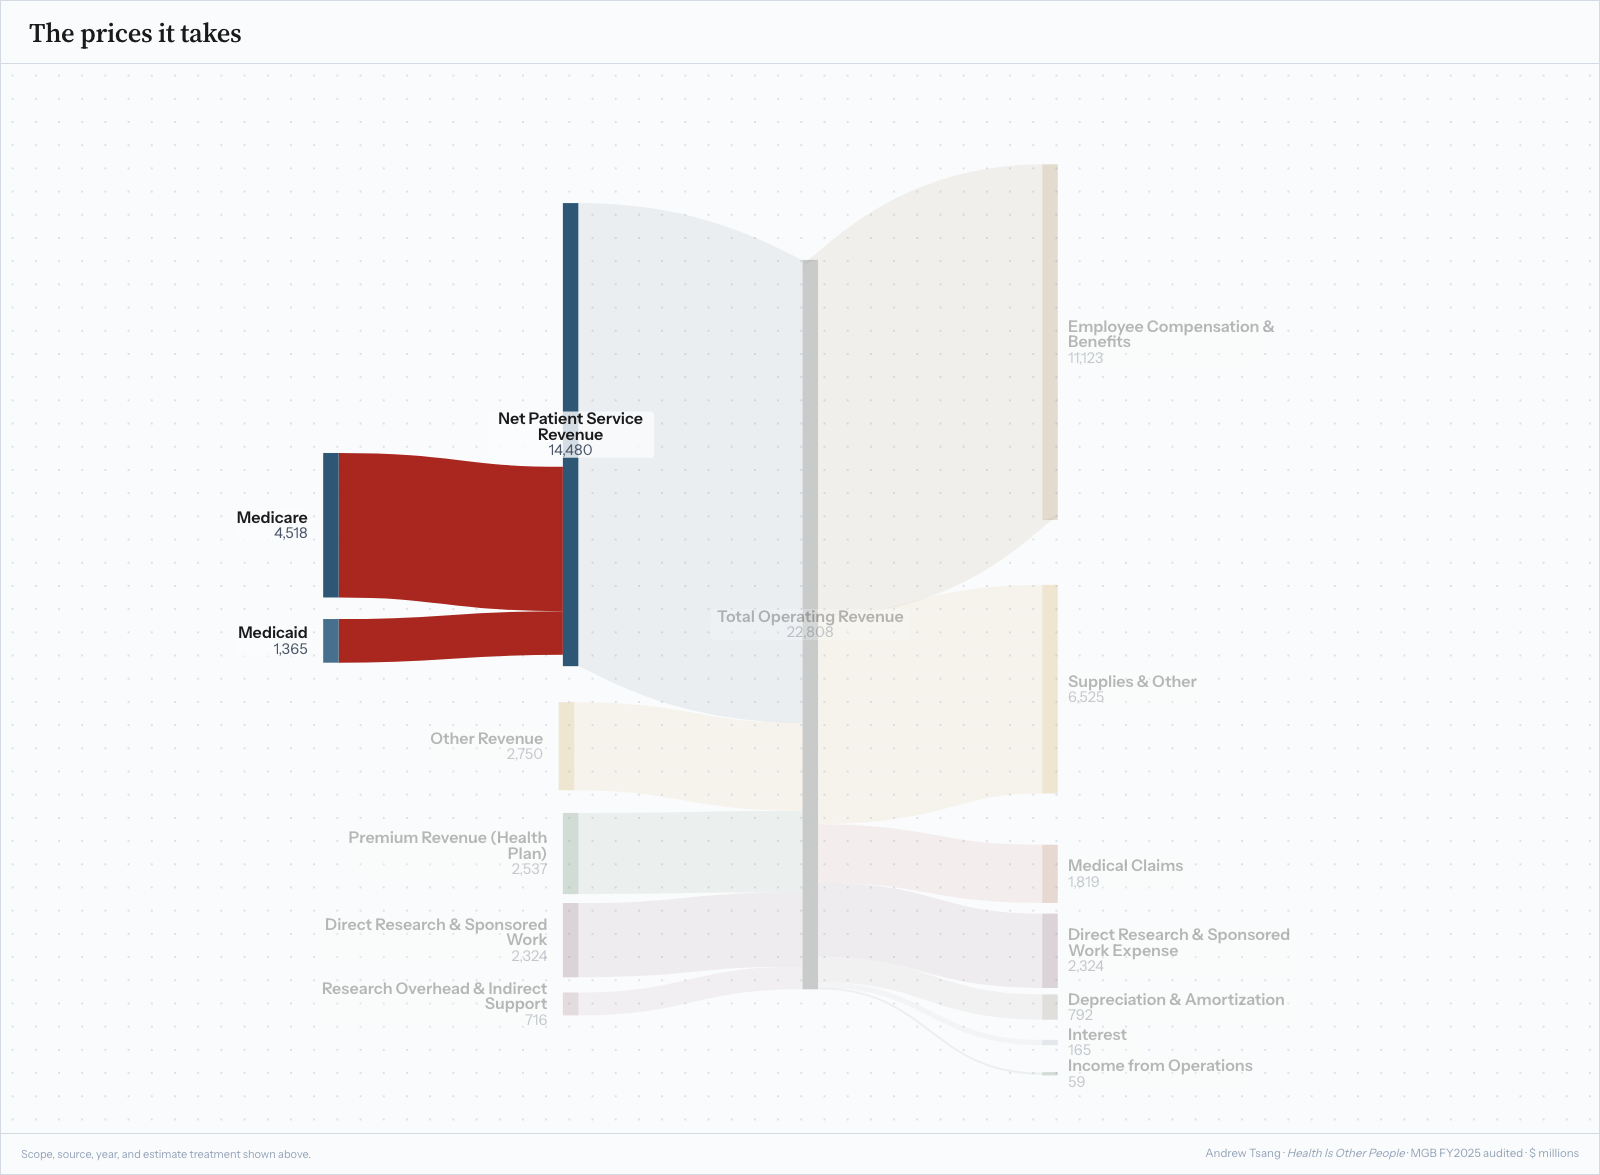
About $4.5 billion came from Medicare and $1.4 billion from Medicaid: $5.9 billion altogether, or 40.6% of MGB’s patient revenue. CMS - Centers for Medicare and Medicaid Services - sets traditional Medicare rates, while state Medicaid agencies establish MassHealth payment rules and fee-for-service rates. Across federal and state programs, MGB operates largely under terms it does not control. Even the most prestigious hospital in the city looks up to the Hills - both Capitol and Beacon.
MGB can improve its coding, change which services it offers, and advocate for different public rates, but it cannot close a payment gap simply by naming a higher price. Even a health system this powerful remains a price-taker here, spending a large part of its life working around public prices it did not set.
The prices it makes
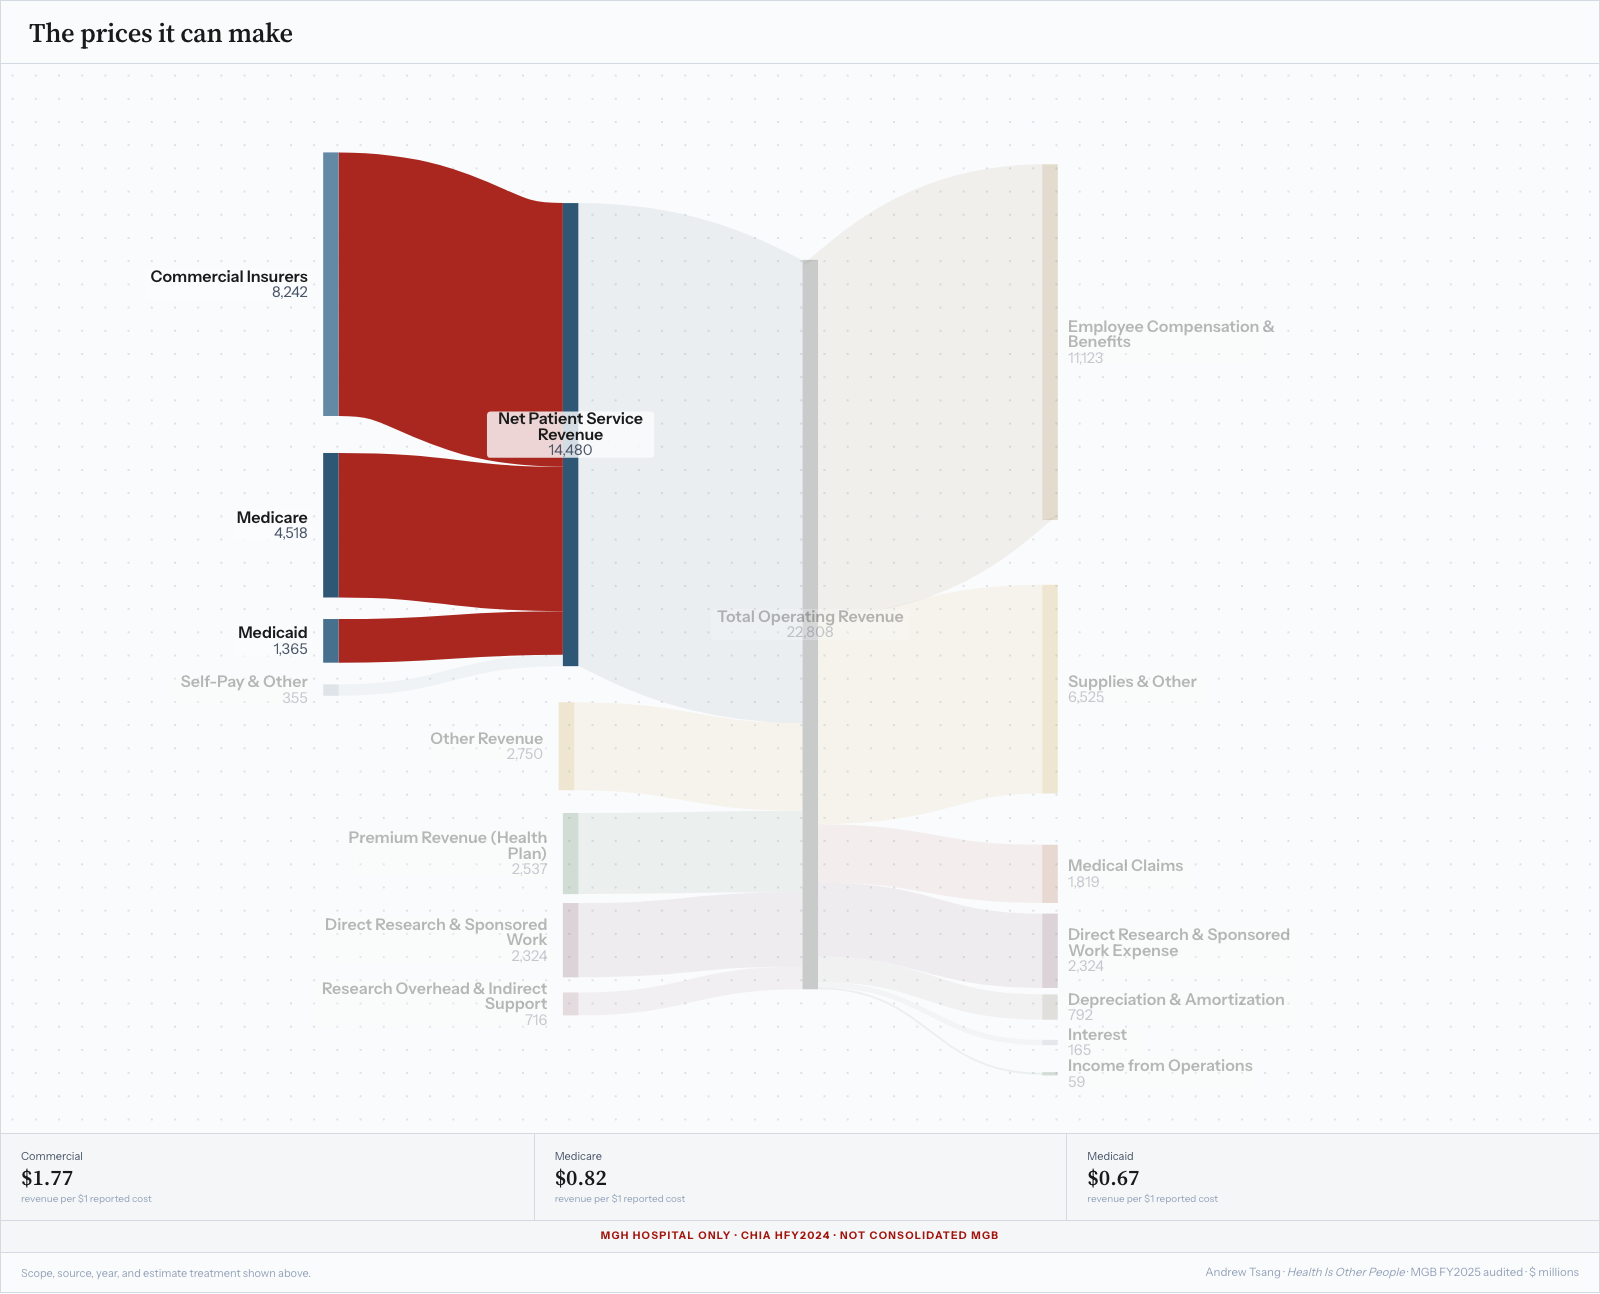
A hospital has leverage when an insurer needs it more than it needs the insurer. In October 2000, Tufts Health Plan balked at a rate increase from Partners HealthCare (now rebranded MGB). In a bold move, Partners said it would stop accepting Tufts insurance the following April. It turns out it never had to! Employers and thousands of members threatened to leave Tufts instead - and a little more than a week later, Tufts gave in. That is bargaining power: not naming a price alone, but being hard enough to replace that the insurer gives first.
At Massachusetts General Hospital—one hospital, not the consolidated MGB system—for every dollar it reported spending on commercial patients, it took in about $1.77. For every reported dollar of cost, Medicare paid about 82 cents and Medicaid about 67 cents. These are broad revenue-to-cost ratios, not the same procedure paid three ways2. The point is simpler: public programs paid below reported cost, while commercial insurers paid far above it. MGH could ask for more because an insurer selling a Boston network had little leverage to leave it out.
The mix of the pieces
When I first got into healthcare consulting, executives kept talking about payer mix, and I could not understand why they were so worked up over a pie chart. I assumed the point was cross-subsidization: commercial plans pay more to help cover what Medicare and Medicaid leave short. That higher price eventually returns through employer premiums and workers’ paychecks, so the subsidy does not disappear; it moves.
After watching payer mix drive hospital M&A discussions, I finally got it. The chart tells an acquirer what kind of revenue it is buying: how much care gets paid at public rates the hospital mostly takes, and how much comes through commercial contracts its name and network can move. Payer mix tells you how much of a hospital’s patient revenue is tied to prices it mostly has to accept, and how much depends on deals it can negotiate. The hospital’s goal is to make the Commercial slice of the pie chart as big as possible.
The insurance inside
One of the businesses inside MGB is its own insurer, Mass General Brigham Health Plan. Here the piece that changes hands is risk. When MGB’s hospitals bargain with Blue Cross, they are selling care. When its own health plan collects $2.5 billion in premiums and pays $1.8 billion in medical claims, the same institution is buying care instead.
Those two ribbons may look like a $700 million profit, but they are not. MGB’s consolidated accounts combine several kinds of insurance and remove payments between its health plan and its own hospitals. In Massachusetts’ individual and small-group market, the plan’s three-year average was 84.8%, below the state’s 88% floor, so it had to pay the difference back to policyholders. That still does not tell us whether the whole health plan made money.
Owning a health plan is quite risky! The premium is set before anyone knows who will get sick, which drug they will need, or how much their care will cost. When MGB sells care, payment is revenue. When its health plan collects a premium, that same care becomes an expense to manage. Integration puts both calculations under one roof; it does not make them the same calculation, and other large systems have struggled to keep both sides together.
Following the instructions
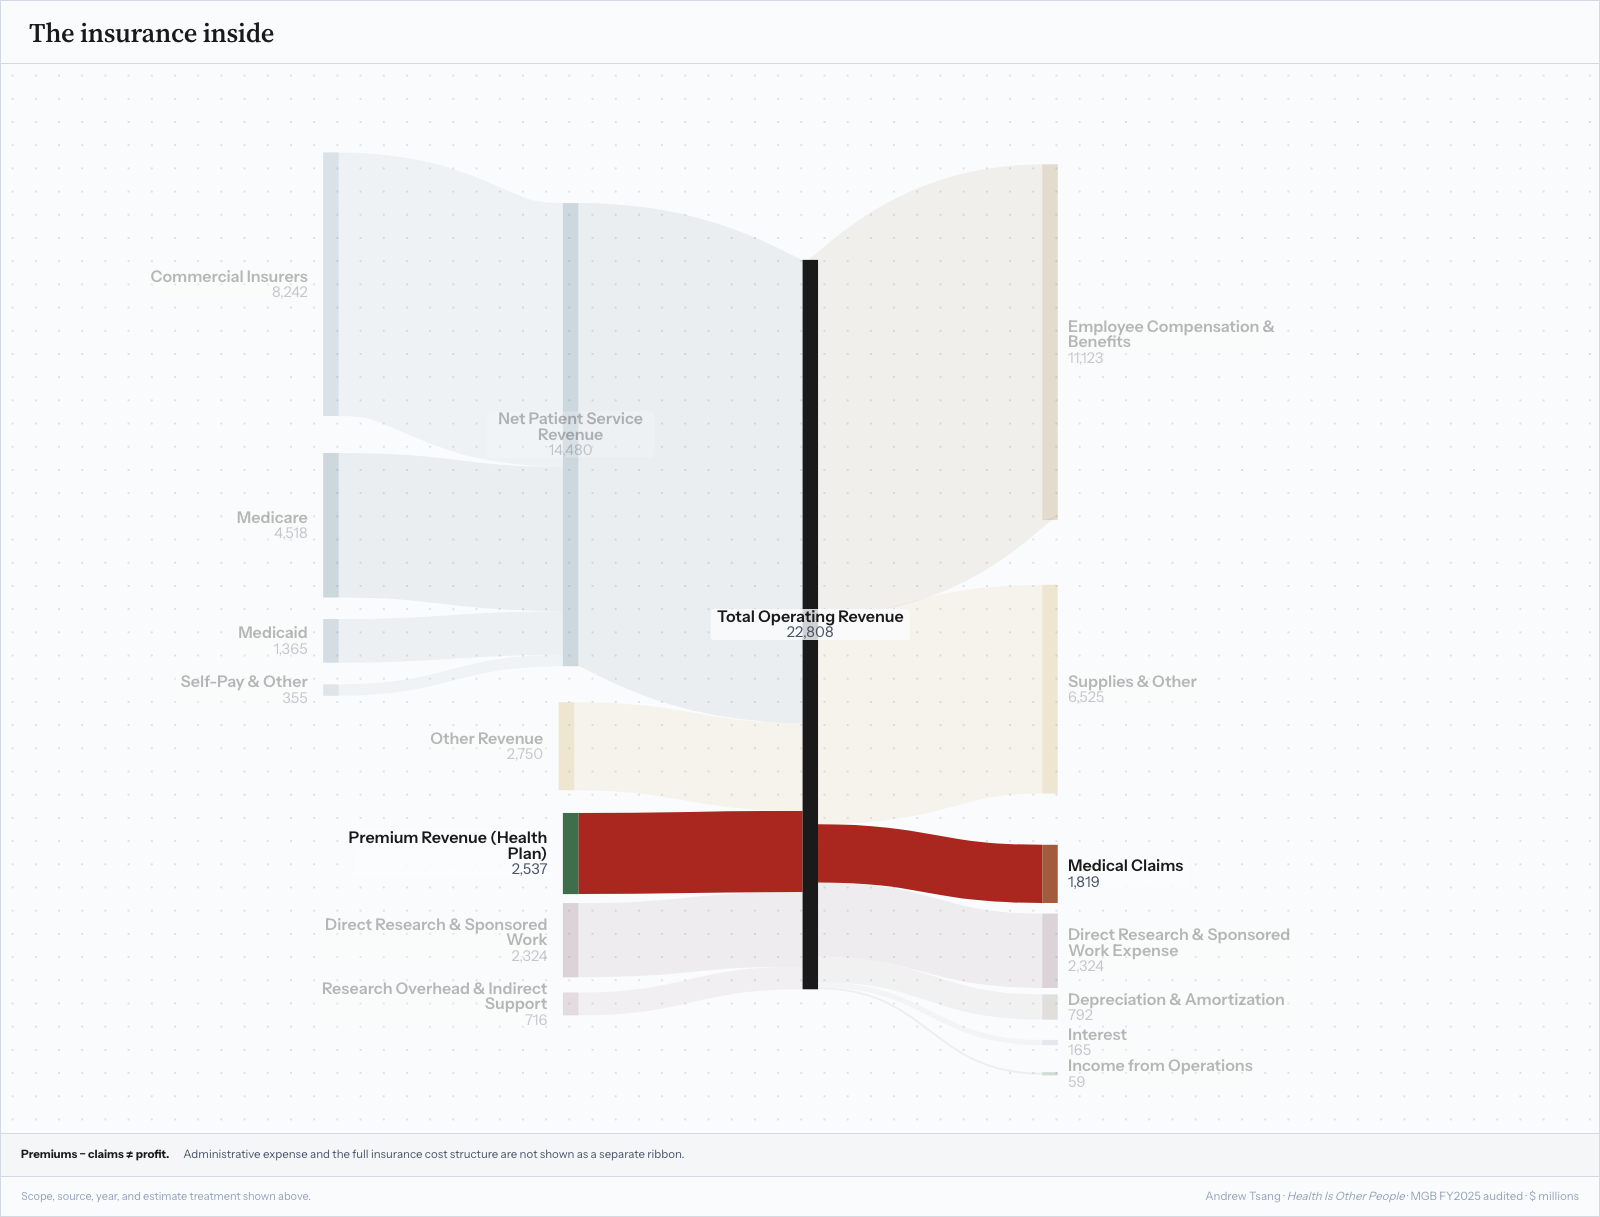
Another way MGB makes money is through research. MGB reported $2.3 billion in direct research and sponsored-work revenue, a scale few hospitals can match. It helps to be Harvard-affiliated in the biotech center of the world. But on the operating statement, the two research ribbons basically net out to zero: MGB reported the same $2.3 billion in related expense. That makes sense because grants and contracts arrive with specific instructions. This is money for a job, not cash the hospital can move wherever it wants.
But don’t confuse not being profitable with not adding value. What it buys is laboratories, trials, scientists, and the standing that makes Mass General Mass General. The two flagship hospitals, MGH and the Brigham, ranked first and second among hospitals for NIH funding in 2024, drawing a spanking $655 million and $388 million, respectively. The same year: an MGH researcher won the Nobel Prize for discovering microRNA, and a Mass General team made huge leaps in a new CAR-T treatment for glioblastoma. Research does not create much visible margin in this ribbon. It creates treatments, talent, and prestige - all of which help MGB make more money in the long run.
Drugs sold separately
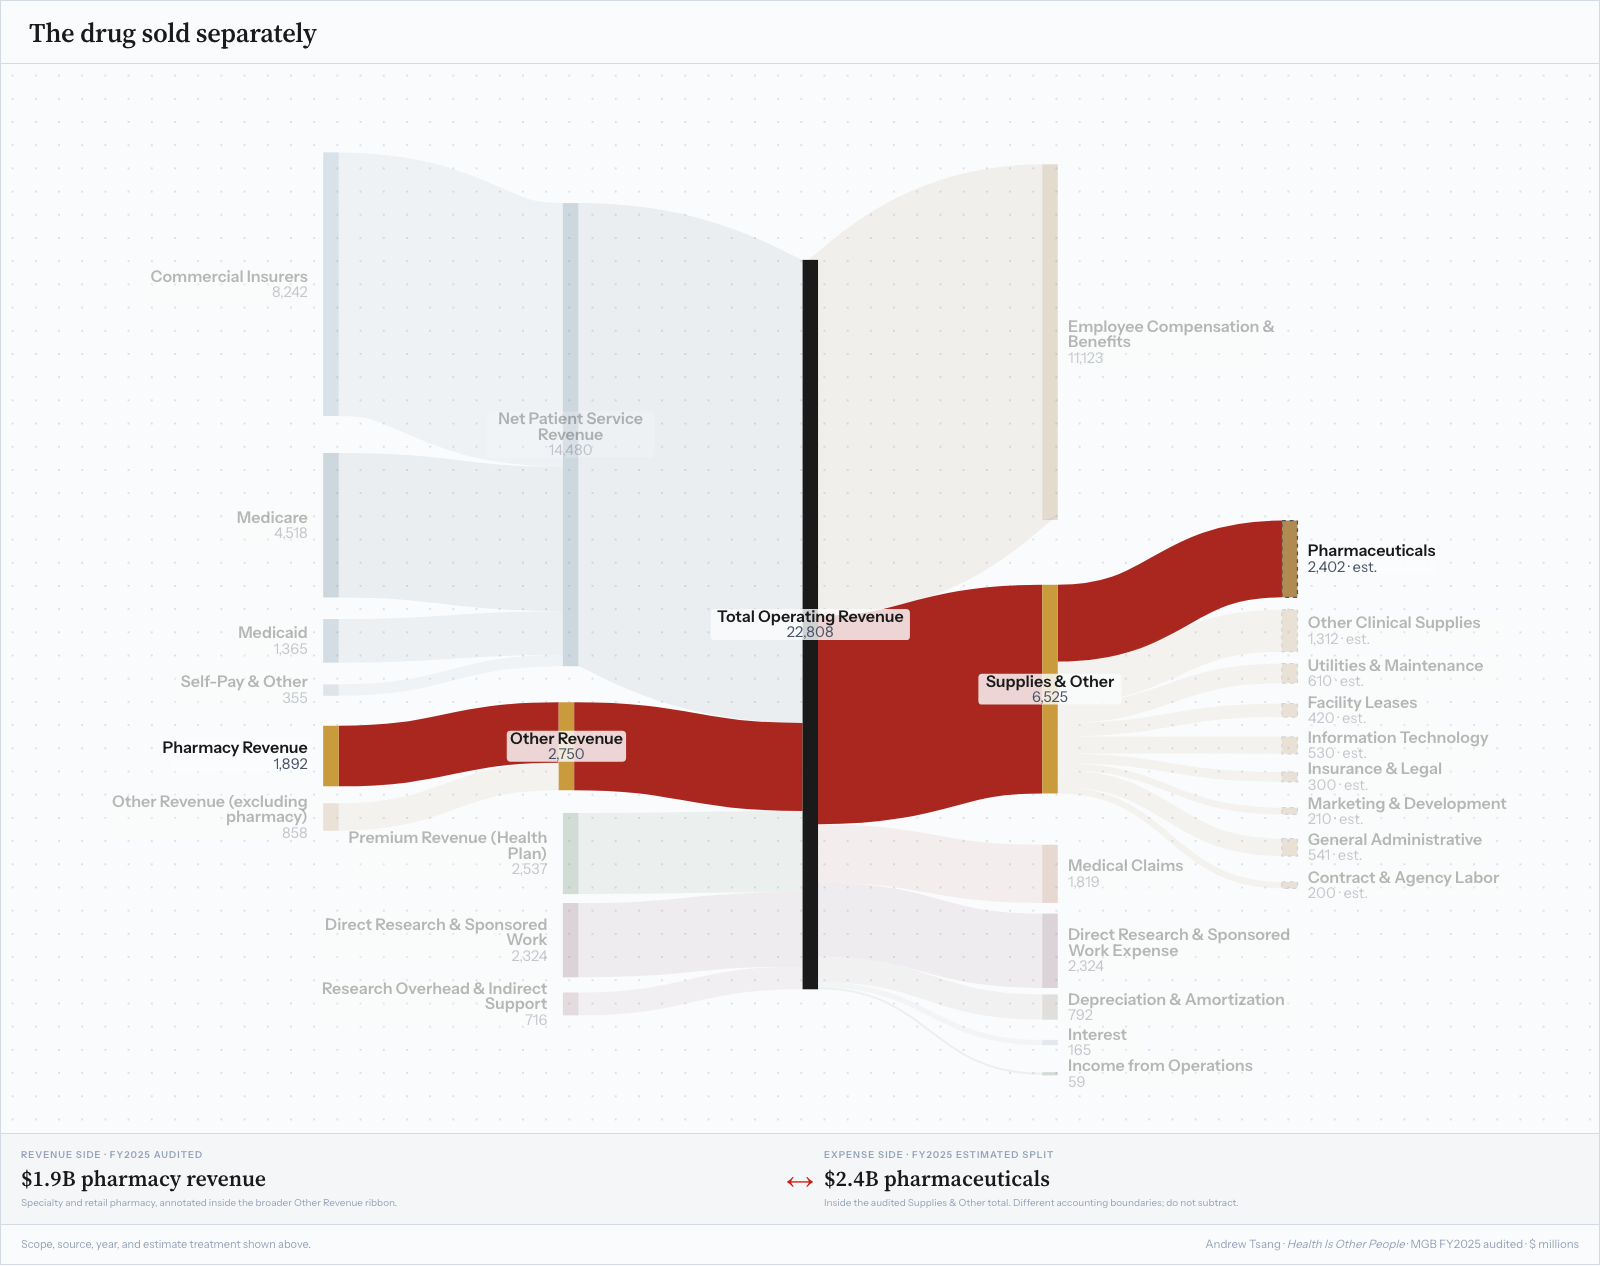
A drug dealer’s business model is simply: buy drugs and then sell them. I’m being coy, but that’s basically the easiest part of MGB’s pharmacy business model. MGB’s $1.9 billion of specialty and retail pharmacy revenue comes from dispensing drugs and collecting payment from insurers on the left side of the diagram. And on the right, the health system buys pharmaceuticals before a patient can receive them.
Not all drugs are equal. Take Casgevy, the first FDA-approved treatment to use CRISPR gene editing. It is a literal medical miracle—manipulating DNA at the molecular level to treat sickle-cell disease, an inherited and debilitating disease that predominantly affects Black Americans. One dose can alter the course of a patient’s life. Its wholesale price is $2.2 million, set by Vertex Pharmaceuticals (headquartered right there in the Seaport), and Mass General was one of the first places in the world to deliver it.
Yet here the most powerful health system in Boston is the price-taker: there is no generic Casgevy on the shelf beside it. MGB can negotiate reimbursement, acquisition terms, and the rest of the episode, but it cannot conjure a second manufacturer to bid the price down.
MGB’s own pharmacy is therefore the hinge of the page. The system can collect money for dispensing a drug, then turn around and take someone else’s price when it buys another. Few hospital pharmacies will deliver a drug as spectacular as Casgevy, but all of them sit somewhere between what a manufacturer charges and what a payer will reimburse.
Unswappable pieces
Scale helps when one box of gloves can replace another. MGB can probably squeeze the price of ordinary gauze, bandages, and scalpels—the same way Walmart can squeeze its suppliers on commodity goods. But a hospital supply chain contains thousands of products moving through twelve hospitals - subject to shortages, expiration dates, clinician preferences, and the basic question of whether two products are actually interchangeable - and scale only helps when there is another supplier to choose.
Scale helps much less after a hospital builds a surgical program around a proprietary machine. Mass General uses Intuitive Surgical’s da Vinci robot. A new system sells for roughly up to $3.1 million, and service can run up to $225,000 a year. The operating room is built around it. It even takes about 20-30 reps for a surgeon to get trained on it (not cheap). This is just one example of where changing vendors is no longer like changing gauze3.
In this case, MGB is a price-taker, and it shows up where supplies and other expense rose by nearly 18% to about $1 billion in one year. Pharmaceuticals alone accounted for roughly $540 million of the increase. And not to mention how much is attributed to variable factors like inflation, tariffs, higher volume, or dependence on particular vendors. Against a revenue growth of about 11%, this is usually the area where the cost growth exceeds the money hospitals actually make.
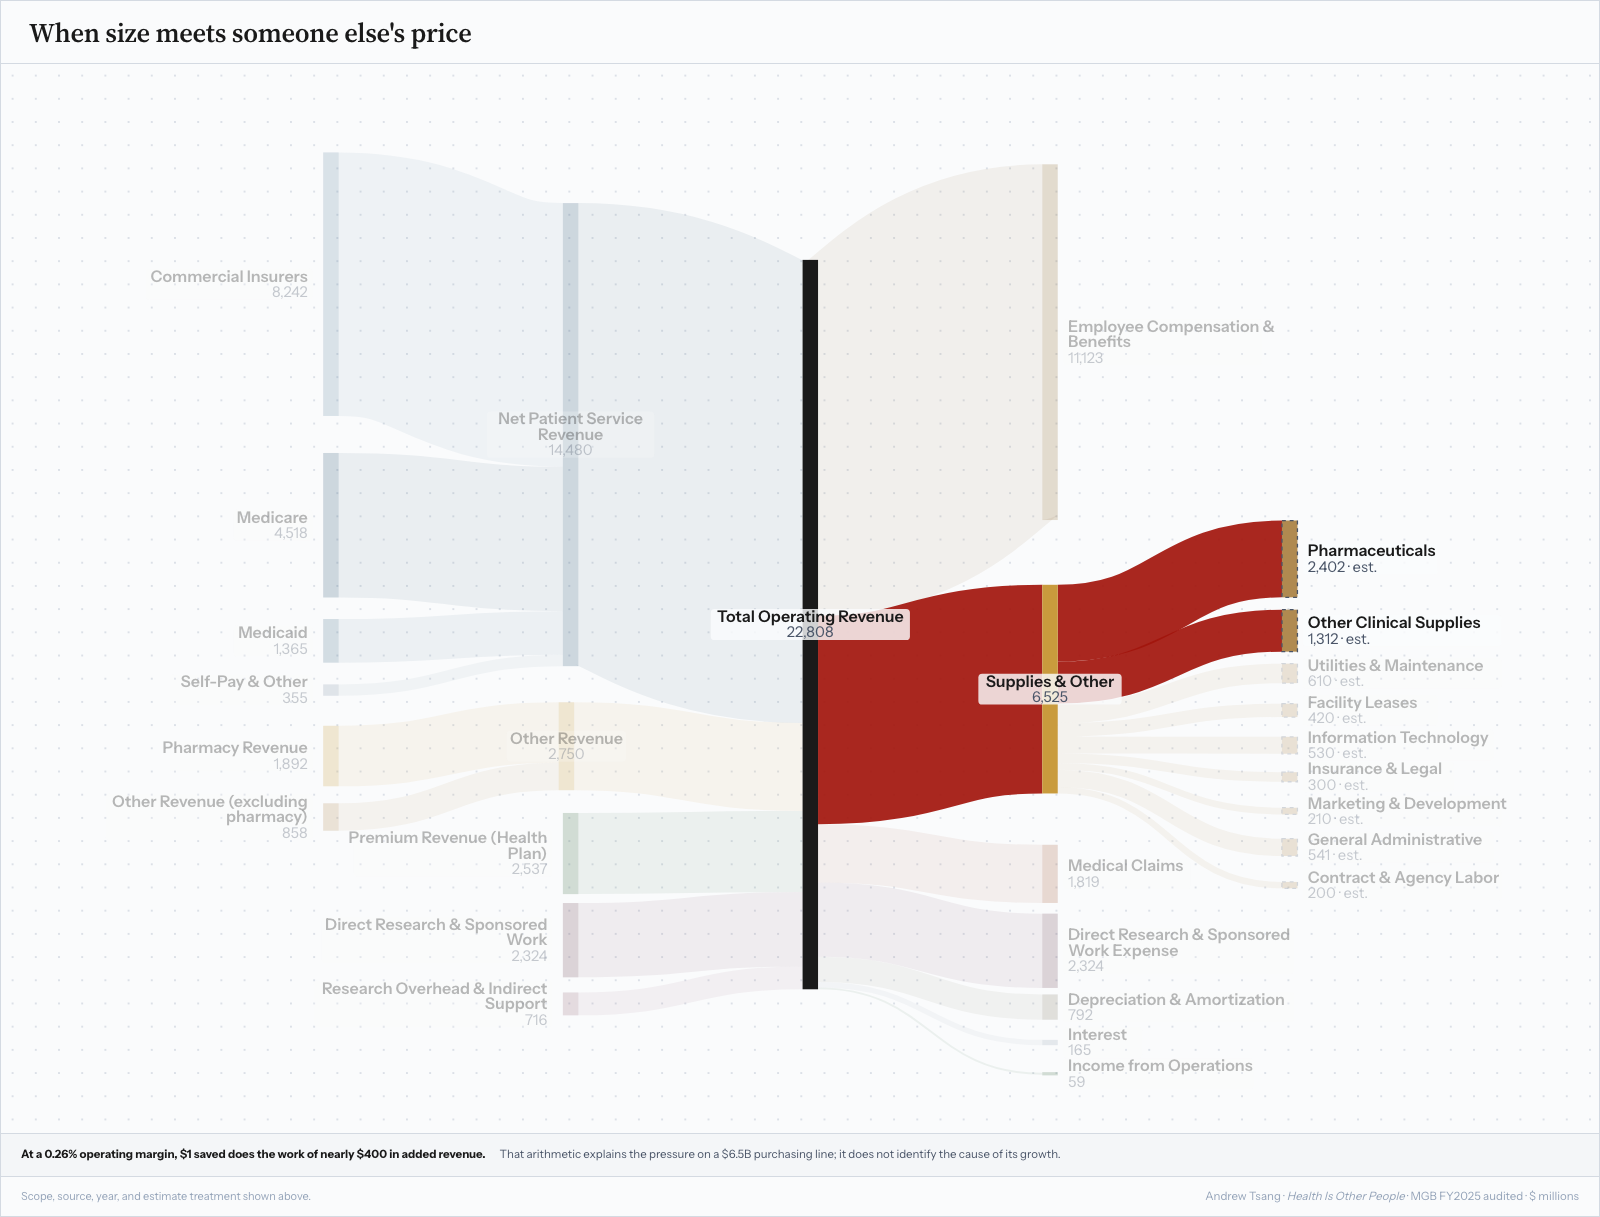
The ribbon on the diagram shows how life-saving drugs and machines cost more and are difficult to replace, but the biggest ribbon shows how replacing people is more difficult.
Inside the biggest number
Most of the businesses inside the box ultimately depend on the same thing: people. The largest visible expense for a hospital is not a drug or a building. At MGB, the line called employee compensation and benefits was a staggering $11.1 billion in FY2025, with salaries, health benefits, retirement contributions, and payroll taxes collapsing into one number.
Even that understates the labor inside the statement. The separate $2.3 billion line for direct research and sponsored-work expense contains another $1.4 billion in compensation. Add it back and the filing discloses about $12.6 billion in employee compensation across operations. Even the scientific work shows the fact underneath the diagram: hospitals are labor-intensive businesses.
MGB counted 84,435 staff in Massachusetts, making it by-far-and-away the state’s largest private employer. In one employer report, it has more than twice the size of the next highest employer in the state - Beth Israel Lahey Health (4 of the top 9 employers were health systems). Health systems are massive everywhere - and they probably are the largest employer where you live too.
The hospital only looks simple with the box closed. Open it and you find a lot of people doing a lot of different jobs: nurses and physicians, scientists and technicians, housekeepers who sanitize the beds, security guards who keep nurses safe from unruly patients, maintenance crews who keep complex machines running, medical billers, call-center operators, regulatory managers, accountants, procurement specialists—nearly every kind of job you can imagine, packed inside one health system. At the end of it all, a hospital is a city’s worth of people to run a building.
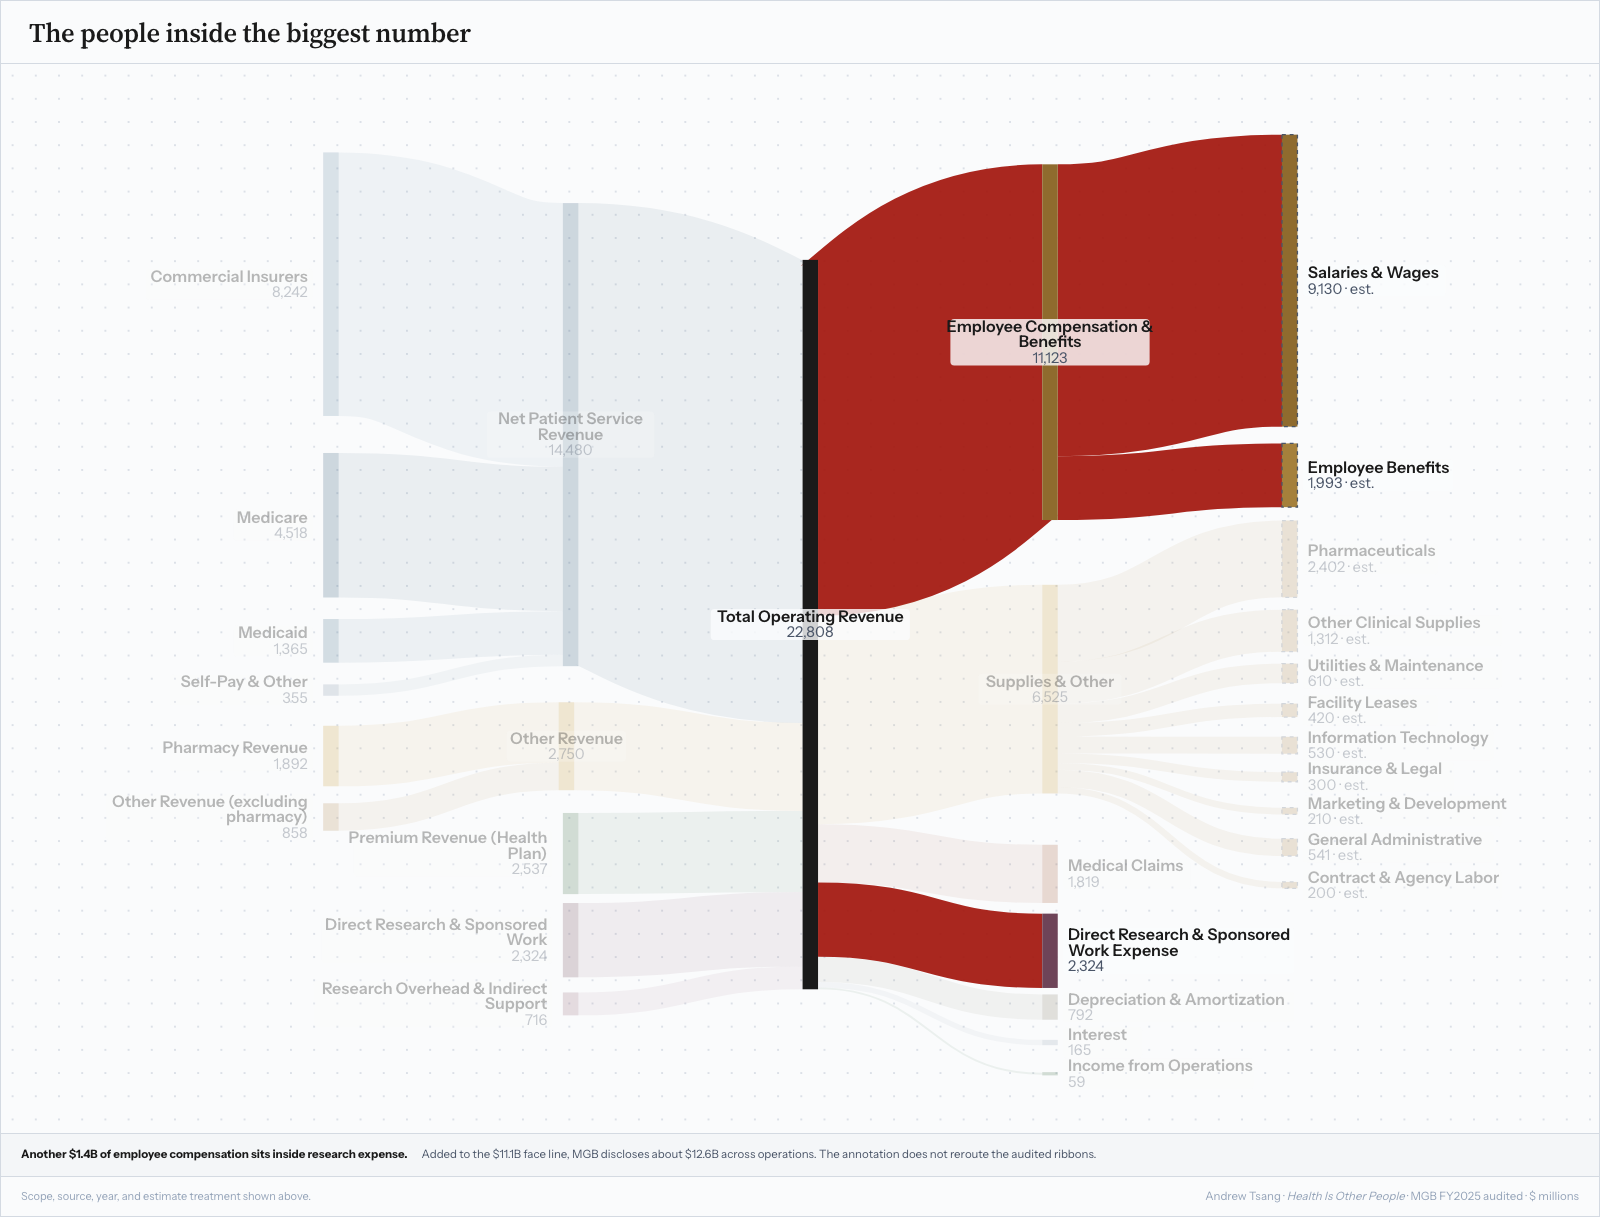
Let’s cut to the chase: how much did the executives make? MGB reported about $8.4 million in total comp for CEO Anne Klibanski, including $2.4 million in base pay and $4.3 million in incentive pay. MGB’s parent corporation also reported $36.2 million paid to current officers, directors, trustees, and key employees, although that is not a clean total for every executive across the health system4. Those figures tell us something about governance - what a nonprofit chooses to reward - but they are not the shape of a $12.6 billion labor ribbon. Erase every dollar of that $36.2 million, and the ribbon would barely move.
Headcount is the lever large enough to move it. In 2025, MGB carried out the largest layoffs in the health system’s history. Press reports put the cuts at roughly 1,500 positions, primarily in management and administration, although the reorganization also consolidated or rescoped jobs and left some vacancies unfilled. MGB said it was removing duplication and layers, and later projected more than $240 million in annual savings. On the hospital’s ledger, that is the case for the cuts.
But “administrative” does not mean consequence-free or even always distant from patients. Reported cuts included six chaplains, a domestic-violence program director, and a tobacco-cessation specialist. The health system records the reduction as savings; the people whose jobs disappear experience it as missing paychecks flowing into mortgages, groceries, childcare, and property taxes. Whatever work remains must disappear, slow down, or land on someone else’s desk. In a labor-intensive business, reducing hospital spending often reaches someone’s paycheck.
The last compartment
The last compartment changes the question from how much MGB earned to which money it can spend now. Income is not net worth. Investments accounted for most of another $2.3 billion of gains outside operations in FY2025, and some of those gains existed only on paper. MGB got richer, but a truckload of cash did not arrive at the emergency room loading dock. Overall, the institution ended the year with $23.6 billion in net assets—with $35.8 billion in assets (the worth of the house) and $12.2 billion in liabilities (the mortgage). The $59 million profit measures one year of operations, not the institution’s wealth.
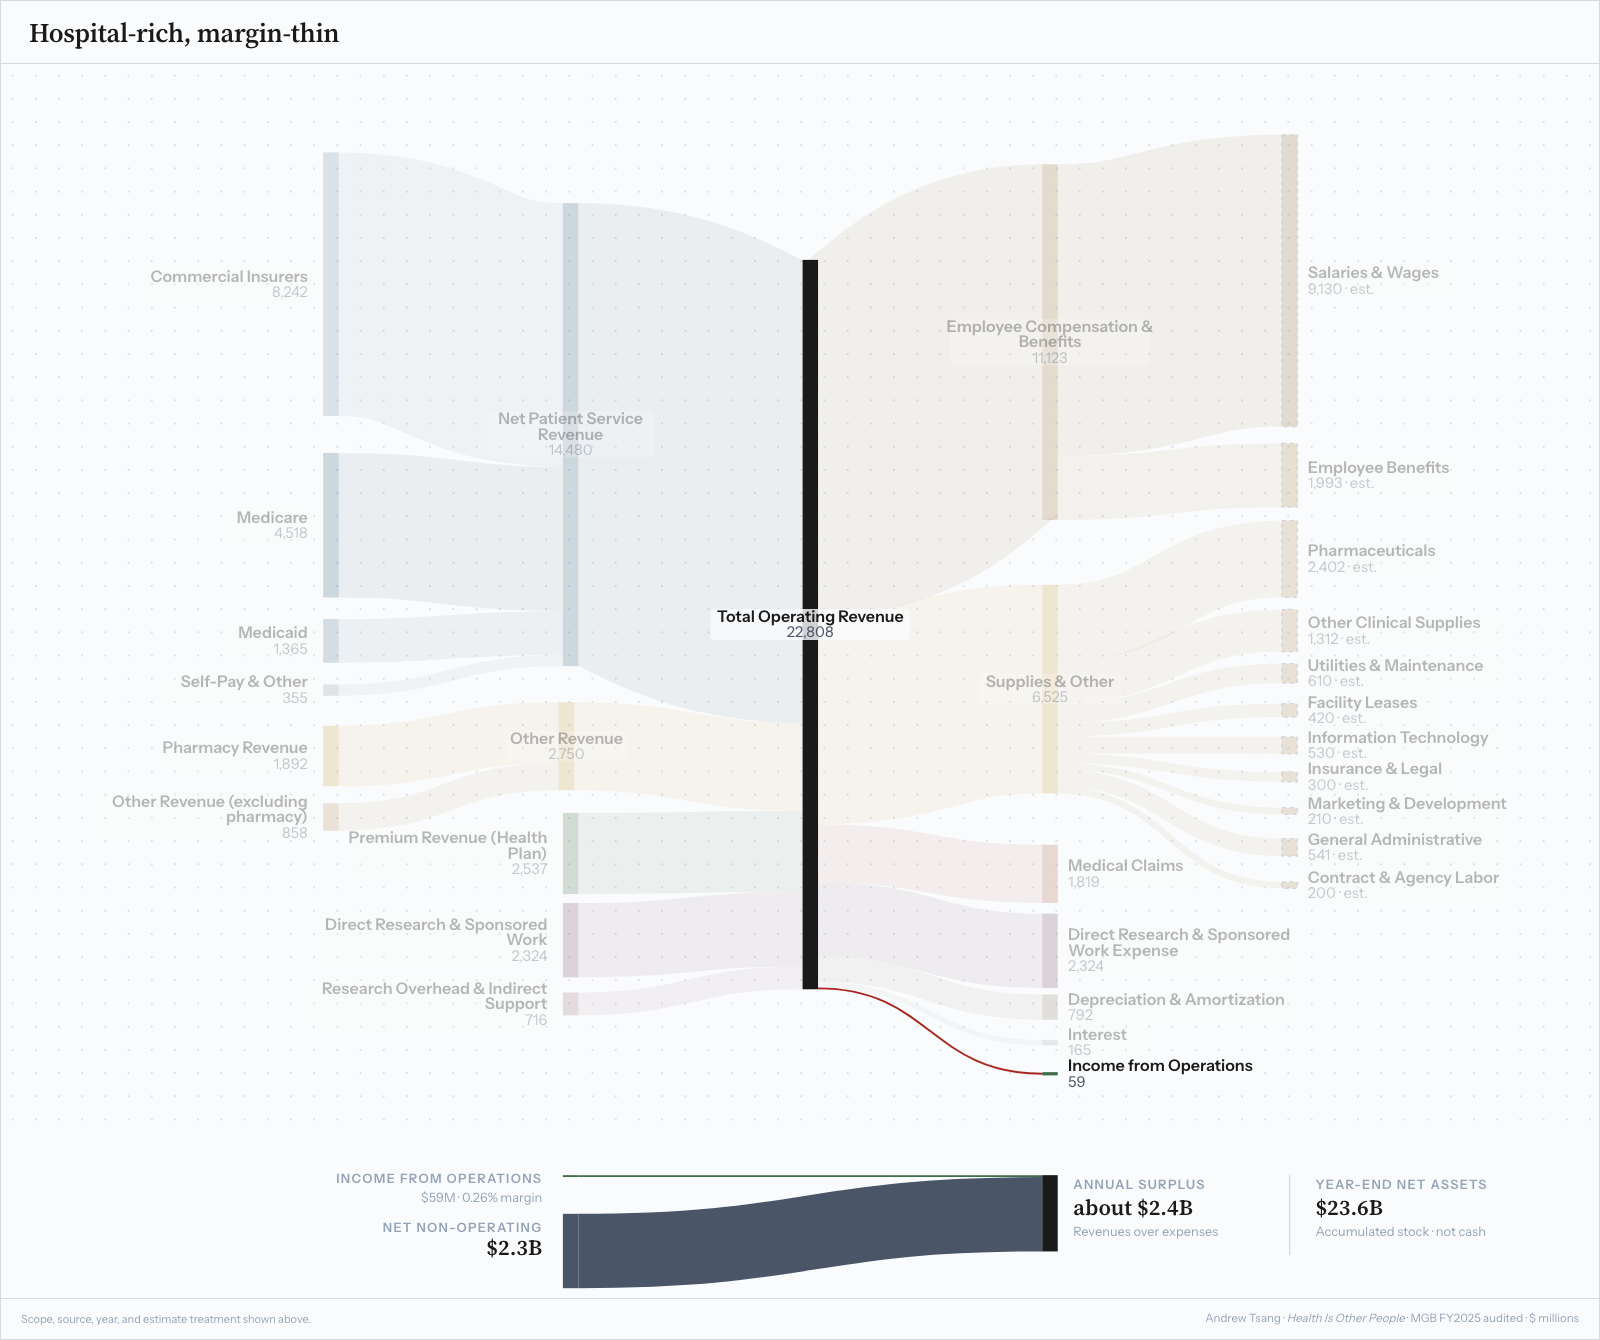
A closer analogy is house-rich, cash-poor. A family can own a home worth far more than it paid 30 years ago and still watch the checking account disappear into the mortgage, utilities, gas, groceries, and every other bill that got more expensive. Most families would not take out a second mortgage to buy groceries5. MGB is not a middle-class family - it is a $23.6 billion institution with choices most families do not have - but the distinction still matters. Buildings, land, endowments, and unrealized investment gains cannot all be spent at the bedside without being sold, borrowed against, or pulled away from whatever they currently support. That does not settle whether MGB should spend more on patients. It tells us which money is available now, and what the hospital would have to give up or mortgage to spend the rest. Mass General is hospital-rich, margin-thin.
So does this diagram show the hospital as filthy rich or crying poor? Both descriptions leave out the transaction behind each ribbon: who pays whom, who decides the amount, and what each side has to do before the money changes hands.
What was inside the box
Mass General’s extremes make it useful to read because normally hidden relationships are large enough to see. Not all smaller hospitals own health plans or research empires, yet they still live among public prices, commercial contracts, capital, suppliers, and labor. The proportions change, but the basic negotiations do not.
The word hospital is doing too much work. On the same statement, MGB bills insurers for care, pays medical claims, performs research under grants and contracts, dispenses drugs, pays employees, and records investment gains and losses. Those activities share one name and one statement, but they do not make or spend money the same way.
I’ve heard hospital CFOs describe the job as a scavenger hunt: looking across Medicare and Medicaid, digging for grants, pharmacy, insurance, and investments for money that can meet the next obligation. The question is not only how much the system earned, but which money can pay which bill, and when.
Hospital-rich and margin-thin sums it up: Mass General Brigham can be immensely rich while the people running it face political, economic, clinical, and market pressure every day.
The trick to the diagram is not to see money, but relationships between each ribbon. Every flow from MGB flows to someone outside it. When Medicare changes a payment rate, the hospital absorbs more or less of the cost gap. When MGB negotiates with Blue Cross, the price returns through employers and workers as premiums. When Vertex prices Casgevy, the hospital can bargain around the episode but cannot manufacture a competing drug. The statement names these as revenue and expense. But when you open it up, they become the price of coverage, the cost of producing care, and the household budgets built around both.
So now I look at hospitals with a lot more focus than I used to, but my son still may never get a hospital playset - because one box would never do it. He would need the ward, the lab, the pharmacy, the insurance office, the investment office, and a small city of people moving between them. That is too much for one playset, which may be the point. From the sidewalk, the hospital still looks like one building. Open the box, and the building becomes a city.
Editor’s note: This is the first of two essays on Mass General Brigham. The second, Massively General, uses a different map to show what a financial statement cannot - the institutions, communities, and public bodies that make decisions with MGB already in the calculation.
Then again, who thinks that hard about their own local hospital?
I love CHIA - the Massachusetts Center for Health Information and Analysis (yes, like the pet). It says there is no industry-standard way to calculate margins by payer. Hospitals report revenue by payer but not the costs, so CHIA estimates them from the severity of inpatient stays and the charges for outpatient care. Wish I had better numbers, but let’s stick with an estimate.
The machine is truly wild: Mass General’s robot-assisted program requires surgeon credentialing, standardized operating-room protocols, dedicated training consoles, quarterly labs, and specialized physician assistants. Intuitive’s 2025 Form 10-K reports the system, instrument, and service ranges.
This was a great find, mostly because it shows how slippery “executive compensation” gets inside a health system. MGB Inc.’s Form 990 Part IX line 5 reports what the parent corporation paid current officers, directors, trustees, and key employees; other salaries and wages, pension contributions, benefits, and payroll taxes are reported separately, while executives paid by related hospitals and other MGB entities may appear on their own returns. Then there is the fuzzy middle: hospital presidents and COOs, service-line chairs who still practice medicine, and layers of lieutenants and captains who hold real power without necessarily appearing on a tax form as “executives.” The broader leadership total is probably higher than $36.2 million, but the public filings do not let us calculate it cleanly. See MGB Inc.’s Form 990 and the IRS instructions.
Yet ironically, some families do get a second mortgage to pay medical bills.
Great piece but it's missing a couple of nuances & I would love to hear more from you on them
1) In the pharma section, how profitable is the specialty pharmacy they are running. My suspicion is VERY (I hear it is 50% of Northwell's total profit) and also in pharma, what about 340b -- PhRMA is spending a lot on Redddit telling me that it's a huge boon to hospitals
2) the $22bn of "equity in the house". Some of that is land/buildings which isnt liquid, some of that is invested in the stock market and acts like a hedge fund. Whatever the latter number is, how did it get so big given the alleged low profitability of the main business, and what do they do with all the profits they make there. Just reinvest?
Anyway, please keep doing these!!